
Ready for a deep dive into the Software as a Service (SaaS) universe?
With so many sources of information available, we’ve gathered these up-to-date SaaS statistics to give you a snapshot of the market in 2023. Whether you’re a business leader, an IT expert, or just tech-curious, there’s something for everyone.
SaaS statistics offer more than just numbers – they provide insight into the entire industry, allowing you to make informed decisions.
SaaS Statistics Highlights
- The SaaS Market: Revenue in the SaaS market reached $213.9 billion in 2022 and is projected to increase to $253.9 billion in 2023 (Statista Market Insights, 2023).
- Subscription Models: Nearly 41% of 100 SaaS tools offered a free account in 2023 (Userpilot, 2023).
- Business Efficiency: SaaS-powered workplaces were about 30% more efficient than other types in 2022 (Better Cloud, 2023).
- Data Privacy: 82% of security breaches involved data stored in the cloud in 2023 (IBM, 2023).
- SaaS and AI: 82% of cloud companies already have AI-driven features in their SaaS products (BVP, 2023).
SaaS Adoption and Market Trends
Diving into the latest SaaS statistics reveals a booming industry with remarkable revenue milestones and dominant market players.
Here’s a comprehensive look at the SaaS stats and data, offering insights into the software-as-a-service statistics and trends that are shaping the future of the digital landscape.
Revenue in the SaaS market reached $213.9 billion in 2022 (Statista Market Insights, 2023).
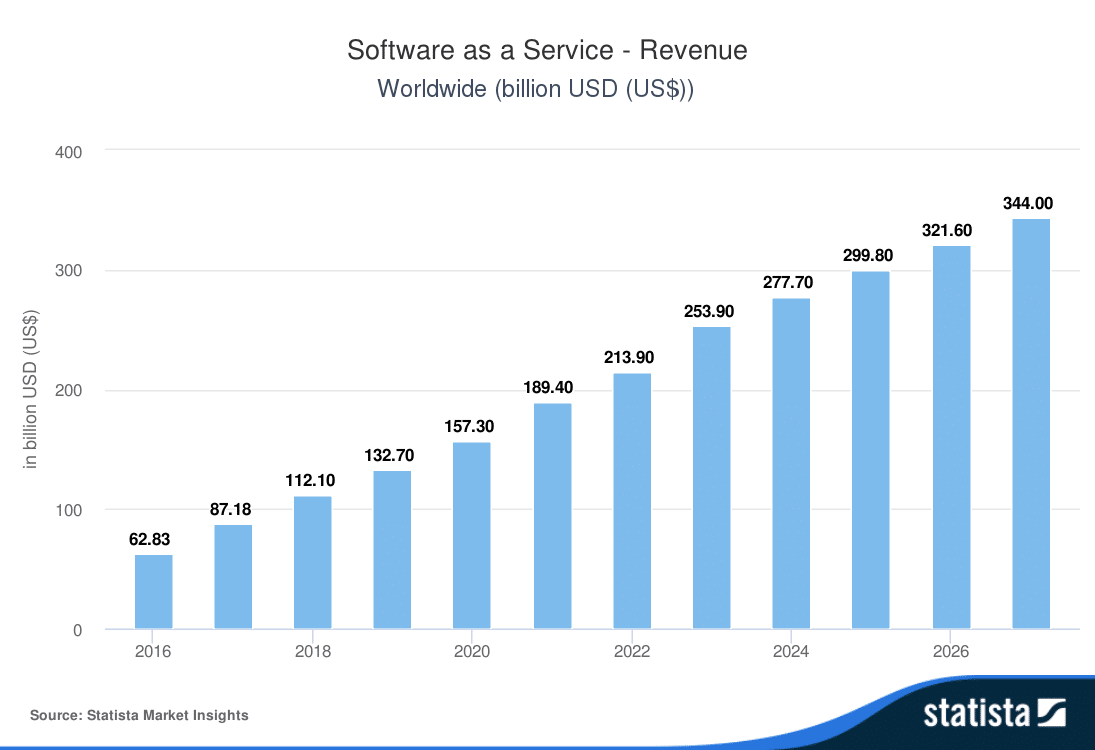
It is projected to increase to $253.9 billion in 2023 and to $344.0 billion by 2027.
Revenue showed an annual growth rate of 12.9% in 2022 compared to 2021 (Statista Market Insights, 2023).
It is projected to grow by 18.7% in 2023 compared to 2022 and 7.0% in 2027 compared to 2026.
When it comes to compound annual growth rate (CAGR), revenue is expected to increase by 10.0% from 2022 to 2027 (Statista Market Insights, 2023).
As of August 2023, the largest SaaS company on the U.S. Stock Exchange was Adobe, with a $239.3 billion market cap (Mike Sonders, 2023).
It was followed by Salesforce ($204.0 billion), Intuit ($145.5 billion), and ServiceNow ($115.0 billion).
On average, organizations used 130 SaaS apps in 2022 (Better Cloud, 2023).
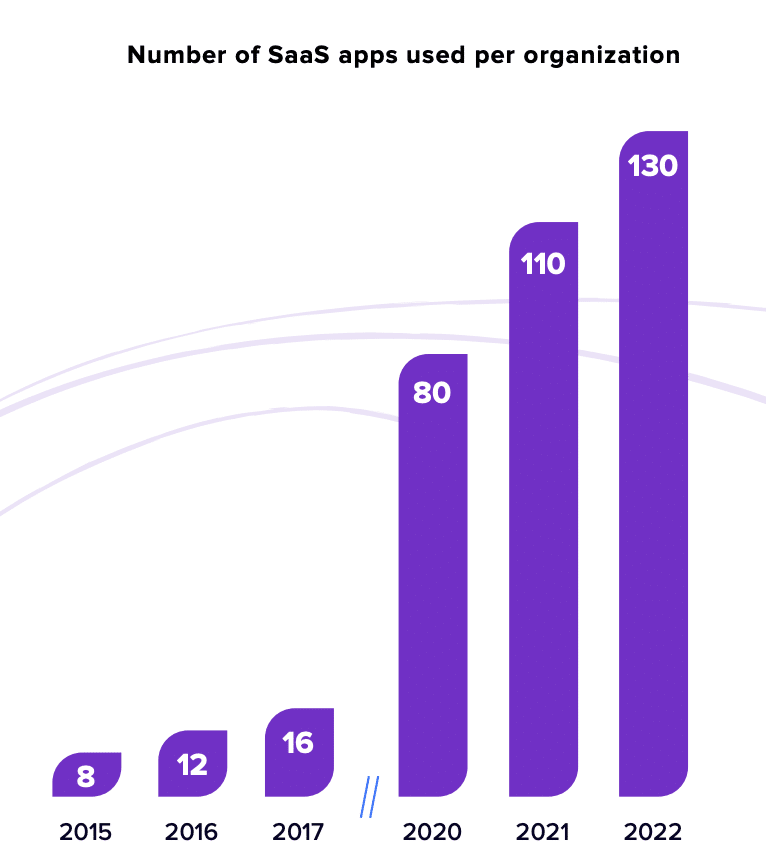
This is up by 18% compared to 2021 (average of 110 apps). However, the yearly growth pace has slowed down – 2021 saw a 38% increase in the number of apps.
Subscription Models and Revenue Streams
Navigating the world of SaaS statistics, it’s evident that different pricing strategies in the SaaS industry are pivotal in shaping customer behaviors. Delving deeper into SaaS stats and data, strategies like freemium models, tiered pricing, and usage-based pricing emerge as tailored solutions to resonate with the target audience.
By aligning pricing with perceived value and staying attuned to the latest software-as-a-service statistics, SaaS companies can craft a pricing model that not only draws in new customers but also fosters loyalty among the existing ones.
In fact, nearly 41% of 100 SaaS tools offered a free account in 2023 (Userpilot, 2023).
Furthermore, nearly 74% offered a free trial. Only 4% of companies didn’t offer any taste of the product, with demo-only versions, compared to 7% in 2022.
Meanwhile, the average annual churn rate of SaaS companies was 5.2% in 2023 (First Page Sage, 2023).
Churn measures the rate at which customers or revenue is leaving a SaaS business.
Broken down further, the monthly net churn rate for best-in-class/top decile SaaS businesses varied according to annual run rate (Chart Mogul, 2023). 
Annual run rate (ARR) is a projection of a company’s current revenue extended over a full year. It helps gauge the recurring revenue that a company expects to earn in the next 12 months.
The monthly net churn rate considers both the customers who leave and those who upgrade or reactivate their subscriptions, providing a more detailed picture of customer behavior.
If the monthly net churn rate is positive, it means more revenue is being lost than gained from existing customers. If it’s negative, the opposite is true – the revenue gained from existing customers (through upselling, cross-selling, etc.) exceeds the revenue lost.
These were the monthly net churn rate rates in 2022 recorded for top SaaS companies, categorized by different ARR levels:
- <$300K: 0.2%
- $300K – 1M: -0.4%
- $1-3M: -1.2%
- $3-8M: -0.8%
- $8-15M: -0.8%
- $15-30M: -1.1%
In 2023, the average ratio of lifetime value (LTV) to customer acquisition cost (CAC) was 6:1 (First Page Sage, 2023).
LTV is calculated using a formula that considers both the average customer lifespan and the average annual revenue per customer. It tells you how much a single customer is worth for your business over their lifetime. CAC, on the other hand, answers the question: “How much does your company spend to close one new customer?” It includes the costs associated with gaining new customers.
According to First Page Sage, a ratio of 6:1 is stable – it results in excellent profits but could use revenue to grow further. The sweet spot would be 4:1.
User Engagement
In the realm of SaaS statistics, user onboarding emerges as a pivotal factor influencing user activation and overall experience. As the latest SaaS data reveals, the initial interaction a user has with a product can set the tone for their entire journey.
In fact, user onboarding has a direct impact on user activation (Userpilot, 2023).
Onboarding is the very first touchpoint a user has with the product. If they don’t have a good time, they’ll likely never return. Keep in mind that this will directly impact user activation, which is the moment the user fully engages or activates the initial set of persona-relevant key features in the product.
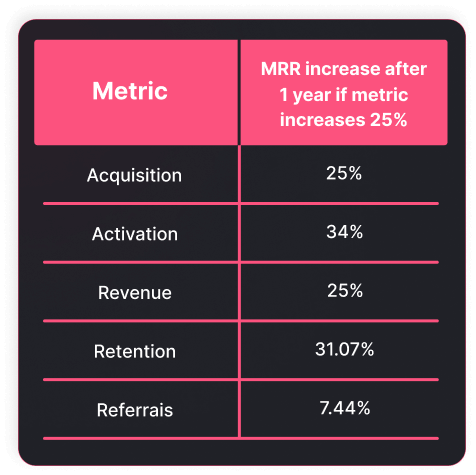
These are the monthly recurring revenue (MRR) increases that can be expected after 1 year if each metric increases by 25%:
- Acquisition: +25%
- Activation: +34%
- Revenue: +25%
- Retention: +31%
- Referrals: +7%
For successful onboarding, a shorter time-to-value (TTV) is extremely important (Userpilot, 2023).
A frictionless signup flow, requiring only a name and email without email confirmation or credit card details, can shorten this time. However, some friction might be beneficial to filtering unqualified leads.
In 2023, 79% of SaaS products still had a friction-based signup flow, typically requiring email confirmation or a credit card. This is a slight increase from 76% in 2022.
Single Sign-On (SSO) is another way to remove friction, and over 53% of tools used it in 2023.
Furthermore, welcoming users is a way to set expectations for what’s coming next in their onboarding and how they can get the most out of the product (Userpilot, 2023).
In 2023, only 66% had a welcome screen, and only 29% had an in-app video. Shockingly, 36% didn’t have any in-app guidance at all.
The average annual customer retention rate varied according to the average revenue per account (Chart Mogul, 2023).
The average revenue per account (ARPA) is the average MRR across all customers. The length of the sales cycle, the tenure of a contract, discounting, onboarding, the type of customer support, and even retention strategies all depend on the ARPA. Higher ARPA levels may justify more personalized support and tailored retention efforts, while lower ARPA levels might lead to more automated or standardized approaches.
These are the annual customer retention rates recorded for top SaaS companies, categorized by different ARPA levels:
- <$25: 75% (likely reflecting more standardized retention efforts)
- $25-100: 84% (increased retention with more targeted strategies)
- $100-250: 87% (further improvement with more personalized engagement)
- $250-500: 90% (showing a strategic balance between high-touch engagement and scalability, ensuring that top-tier customers receive exceptional service without overextending resources)
- $500-1K: 93% (indicating a strong focus on dedicated account management and tailored solutions to meet specific customer needs)
- >$1K: 92% (reflecting a blend of personalized support and exclusive offers, recognizing the higher revenue potential)
SaaS vs. Traditional Software
As seen in the latest SaaS statistics, 2022 marked a significant shift in organizational preferences towards cloud solutions. The inclination towards cloud-based offerings, especially the SaaS model, became evident. Yet, while the allure of the cloud is undeniable, a segment still gravitates towards on-premise software, driven by various concerns.
In 2022, 64.5% of organizations chose cloud solutions (hosted, managed services, or SaaS) (Panorama, 2023).
Meanwhile, only 35.5% of organizations chose on-premise software, which is the traditional type of software that requires installation on individual computers or servers within an organization.
Of those who chose cloud software, slightly more chose a SaaS model (51.7%) rather than a hosted or managed services model (48.3%).
There were various reasons why organizations chose to stick to on-premise software (Panorama, 2023).
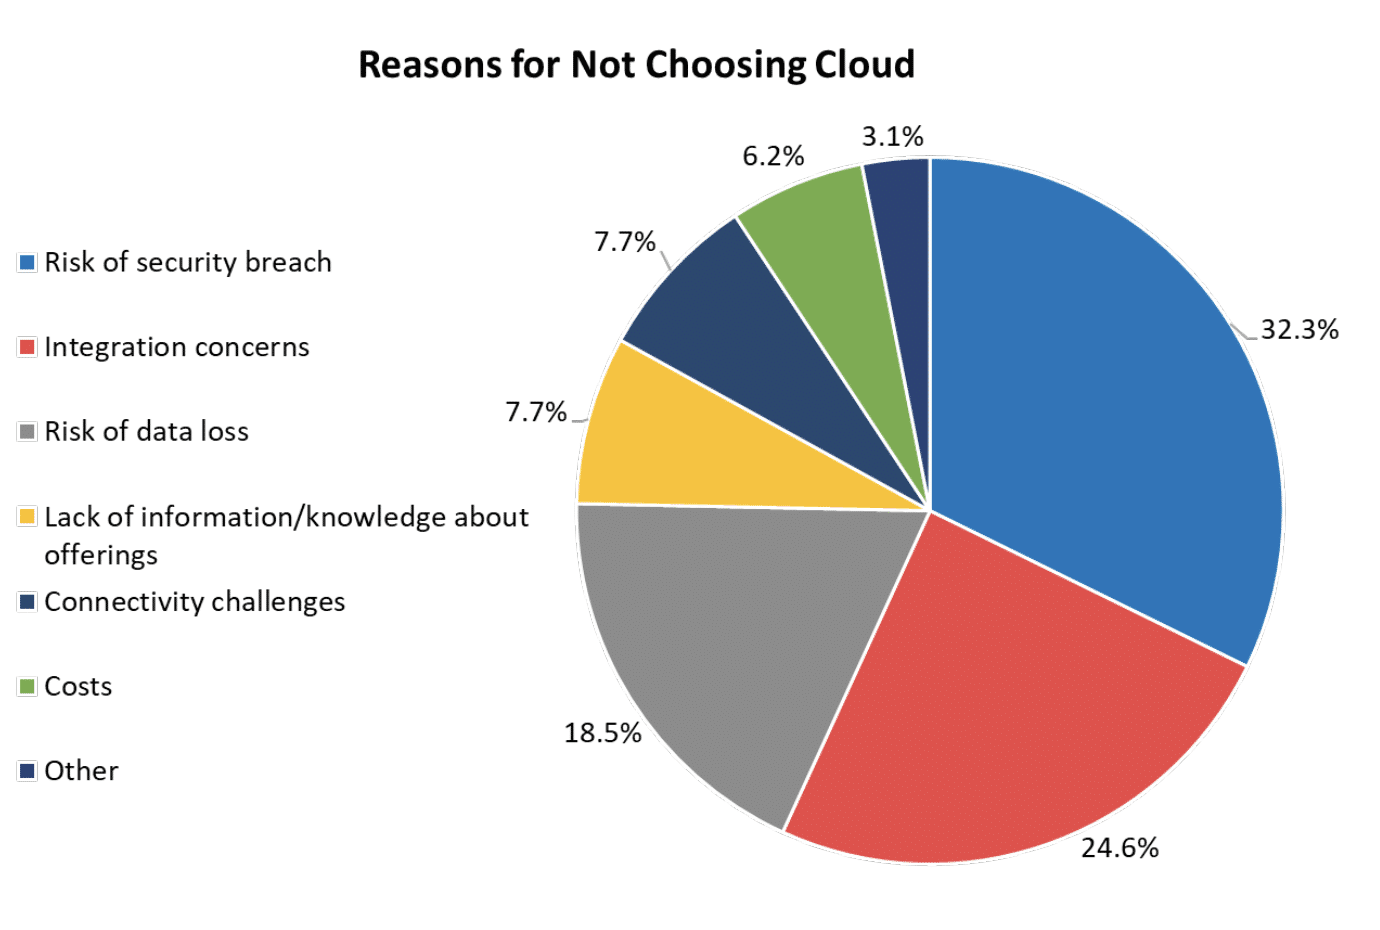
These included:
- Risk of security breach (32.3% of organizations)
- Integration concerns (24.6%)
- Risk of data loss (18.5%)
- Lack of information/knowledge about offerings (7.7%)
- Connectivity challenges (7.7%)
- Costs (6.2%)
- Other (3.1%)
It’s relevant to note that the least common reason for not choosing the cloud was costs. This is because organizations work with third parties to scrutinize vendors’ contracts and ensure the pricing models are reasonable – so even though cloud costs might be higher in the long term, organizations know they are getting a fair deal and saving costs.
SaaS Impact on Productivity
SaaS stats show how millions of companies globally have embraced productivity solutions, revealing not just the advantages but also the evolving budgetary trends and shifts in the work environment. From industry giants like Google Apps and Microsoft Office 365 to specialized solutions in healthcare and education, SaaS is making a significant impact. This section delves explores how these cloud-based solutions are shaping productivity, efficiency, and business outcomes.
8.8 million companies use office productivity products (Enlyft, 2023).
The largest market shares were recorded for Google Apps (48% of companies) and Microsoft Office 365 (45% of companies).
The most significant benefit of using the cloud for businesses in 2022 was adaptability and scalability (53% of respondents) (Fortinet, 2023).
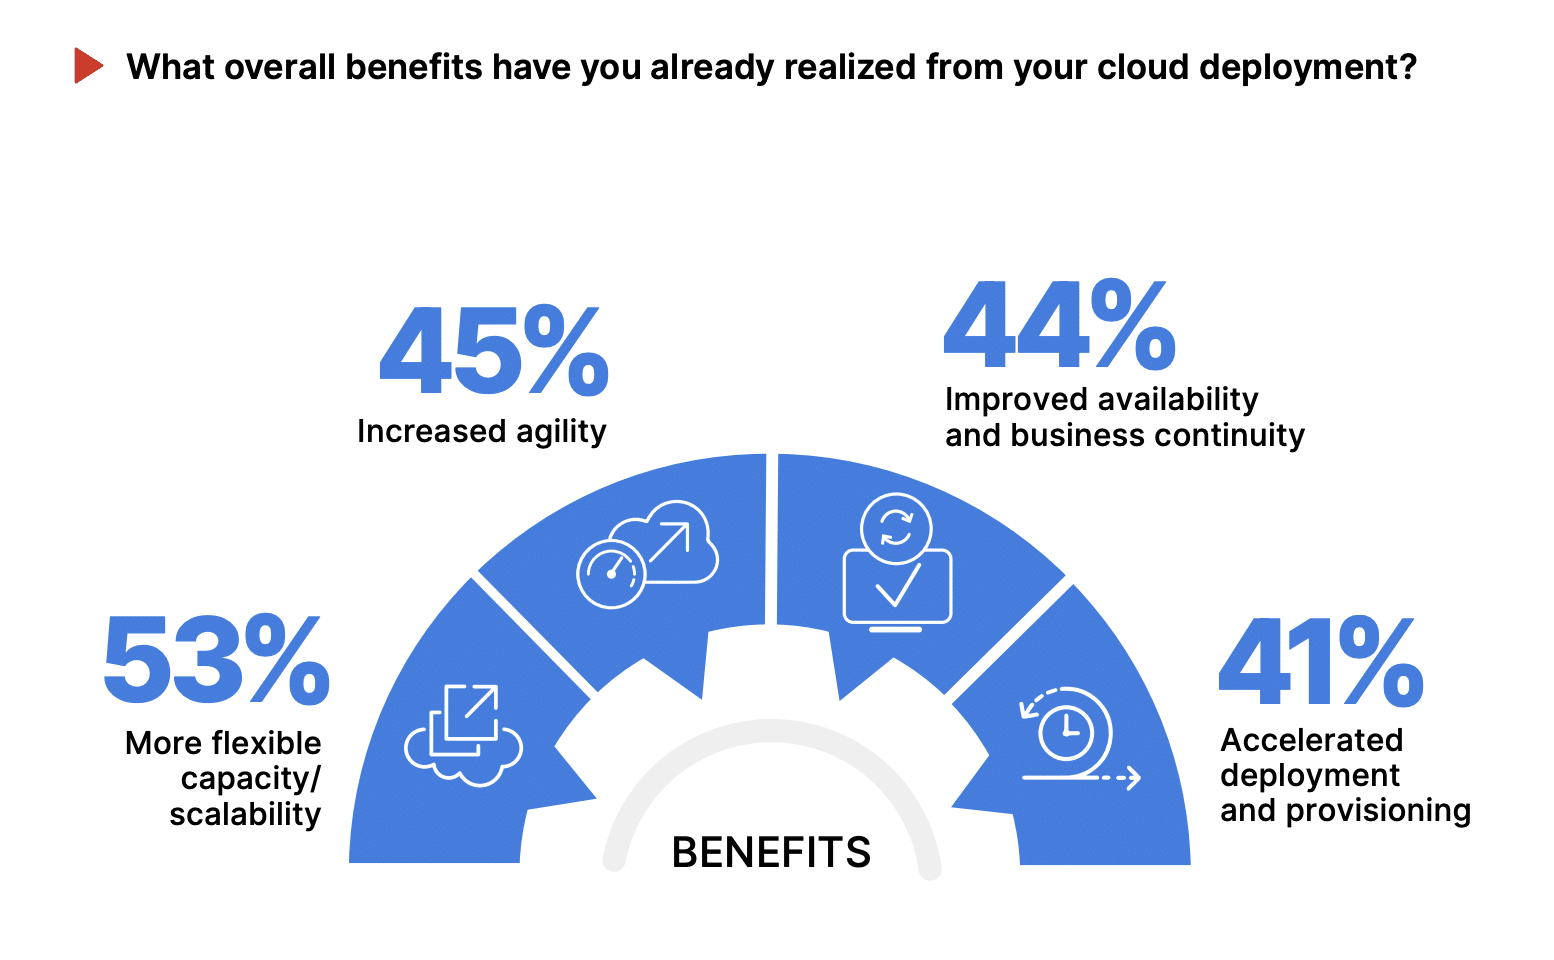
Other benefits included:
- Increased agility (45%)
- Improved availability and business continuity (44%)
- Accelerated deployment and provisioning (41%)
By moving to the cloud, more than half of respondents (52%) reported increased responsiveness to customer needs as a top business outcome (Fortinet, 2023).
Other key business outcomes included:
- Accelerated time to market (48%)
- Decreased risk and improved security (42%)
- Reduced cost (41%)
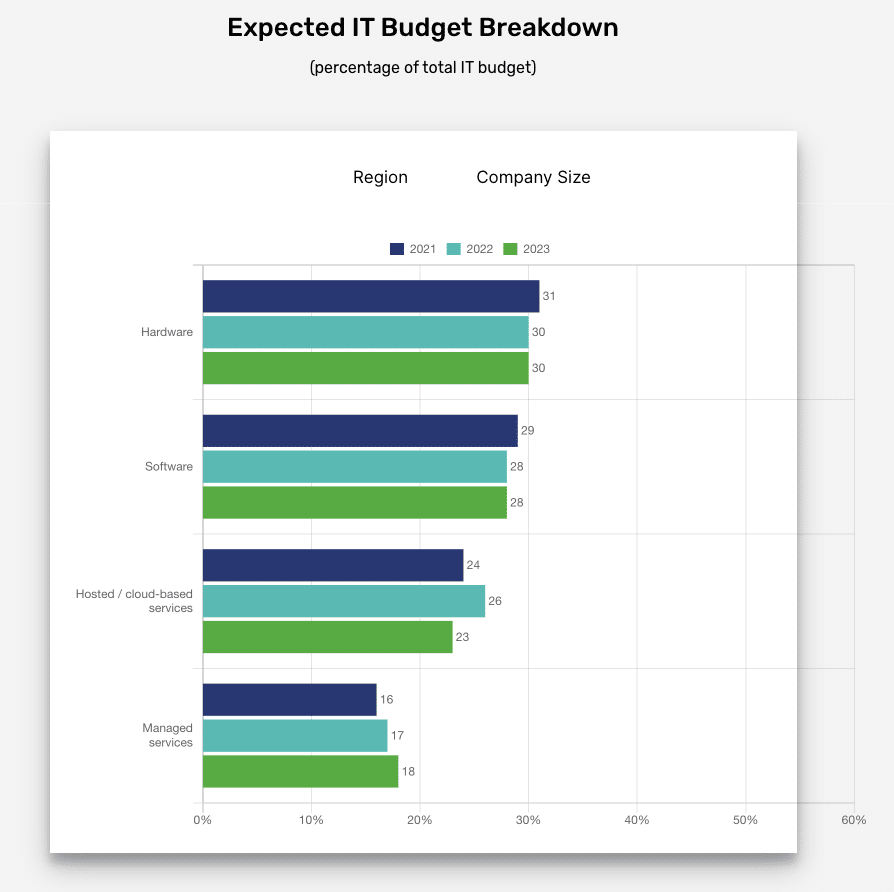
Furthermore, the remote work trend during the pandemic led organizations to pivot from on-premise software to cloud solutions (SWZD, 2023).
Cloud budgeting made up 22% of IT budgets in 2020 and surged to 26% by 2022.
However, with the office comeback around June 2022, projections for cloud budgeting indicate a dip to 23% (SWZD, 2023).
By June 2022, of the companies that had embraced remote work, 85% began transitioning employees back to physical offices. Specifically, 44.4% of these companies brought back all their employees, while 40.1% reintroduced only a portion.
Industry-Specific SaaS Solutions
Healthcare
In 2023, the HealthTech SaaS sector has seen significant activity, with a total of 12.2K companies in the space (Tracxn, 2023).
Of these, 3.6K companies have secured funding, amounting to a total of $62.6 billion.
In 2023, the sector witnessed 56 acquisitions, which is a decrease from the 96 acquisitions observed in 2022 (Tracxn, 2023).
Notably, there has been a 58.7% drop in funding for HealthTech SaaS companies in 2023 compared to the previous year, with the sector raising $2.53 billion across 205 rounds in 2023, as opposed to $6.13 billion across 250 rounds in 2022.
One of the standout companies in the HealthTech SaaS space is Veeva Systems, which went public and has raised $4 million in private funding (Tracxn, 2023).
Other notable companies include:
- AMBOSS: Series B stage with $32.8 million raised
- Modernizing Medicine: Series F stage with $329 million raised
Education
In 2022, the total spend on educational technology by K12s (public and private) was $43.5 billion (Learning Counsel, 2022).
This marked an increase of $6.7 billion compared to 2021. This included spending on computing and other hardware, networking, major software systems, and all digital curriculum resources.
The biggest jump in spending was seen in digital curriculum and content, with $23.9 billion total in 2022 (Learning Counsel, 2022).
This was up by $8.9 billion compared to 2021. This included Populated Learning Object Repositories (LORs), courseware, digital learning objects for lesson plans, digital projects, learning Apps and Applets, video subscription sites, e-learning curricula, digital testing/assessment products, and services.
In fact, as schools and districts shifted to the cloud, on-premise hardware purchases went down by $2.2 billion compared to 2021 (Learning Counsel, 2022).
Indeed, more than 62% of the market implemented office suites in 2022 as quasi-learning management systems.
Plans for future spending in the education sector include solutions that address hybrid/blended learning (Learning Counsel, 2022).
Administrators cited “greater online course options to support all students” as one of the top three pressures.
Impact on Business Efficiency
SaaS-powered workplaces were about 30% more efficient than other types in 2022 (Better Cloud, 2023).
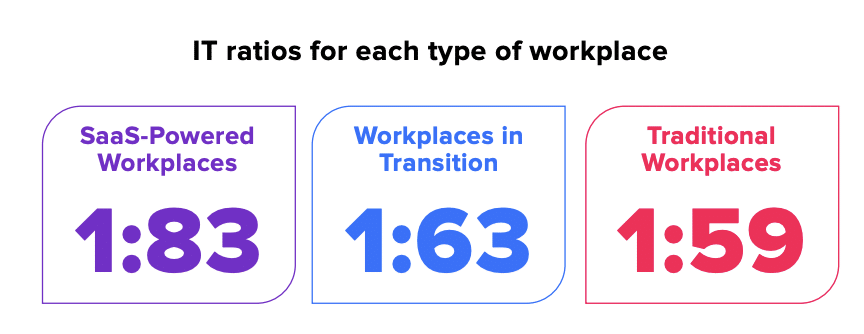
This is because SaaS-powered workplaces had one IT employee for every 83 employees. On the other hand, workplaces in transition had one for every 63, and traditional workplaces had one for every 59. Their heavy reliance on SaaS and effective use of automation makes this happen.
Automation is important to the effective management of SaaS environments (Better Cloud, 2023).
96% of SaaS-powered workplaces agreed on this, with the majority of IT teams prioritizing IT automation (72% of respondents).
Automation of SaaS-related operations can help improve employee experience and the number of tickets (Better Cloud, 2023).
By automating tasks such as password resets and granting access to groups or calendars, IT teams of all sizes can dramatically reduce the number of tickets in their queues.
Automating SaaS management leads to improved operational efficiency and data security (Better Cloud, 2023).
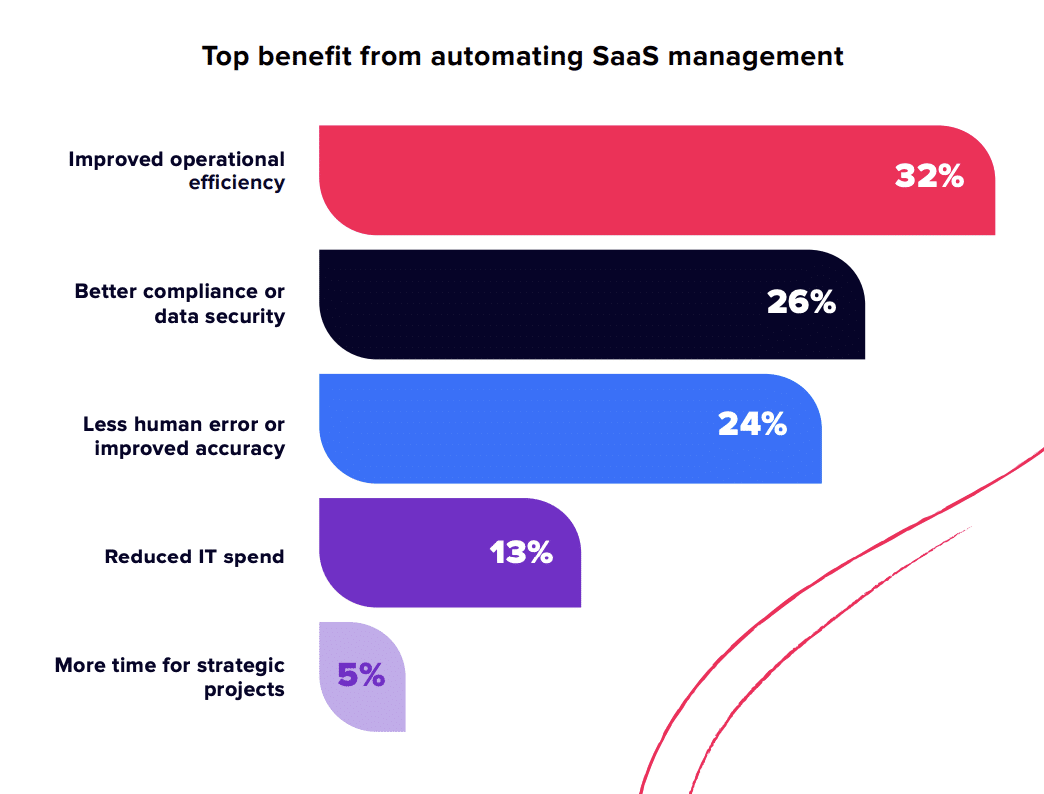
Nearly a third of organizations (32%) stated that automating SaaS management led to improved operational efficiency. Over a quarter (26%) said that it led to better compliance or data security.
SaaS Challenges and Solutions
The SaaS industry has become an integral part of modern business operations, offering a range of solutions that promise efficiency, scalability, and cost-effectiveness. However, the journey towards full SaaS adoption is fraught with challenges that span from technical complexities to security concerns.
In fact, nearly half of respondents (42%) said managing all app configurations consistently was the most crucial challenge to solve in 2022 with regard to SaaS environments in the workplace (Better Cloud, 2023).
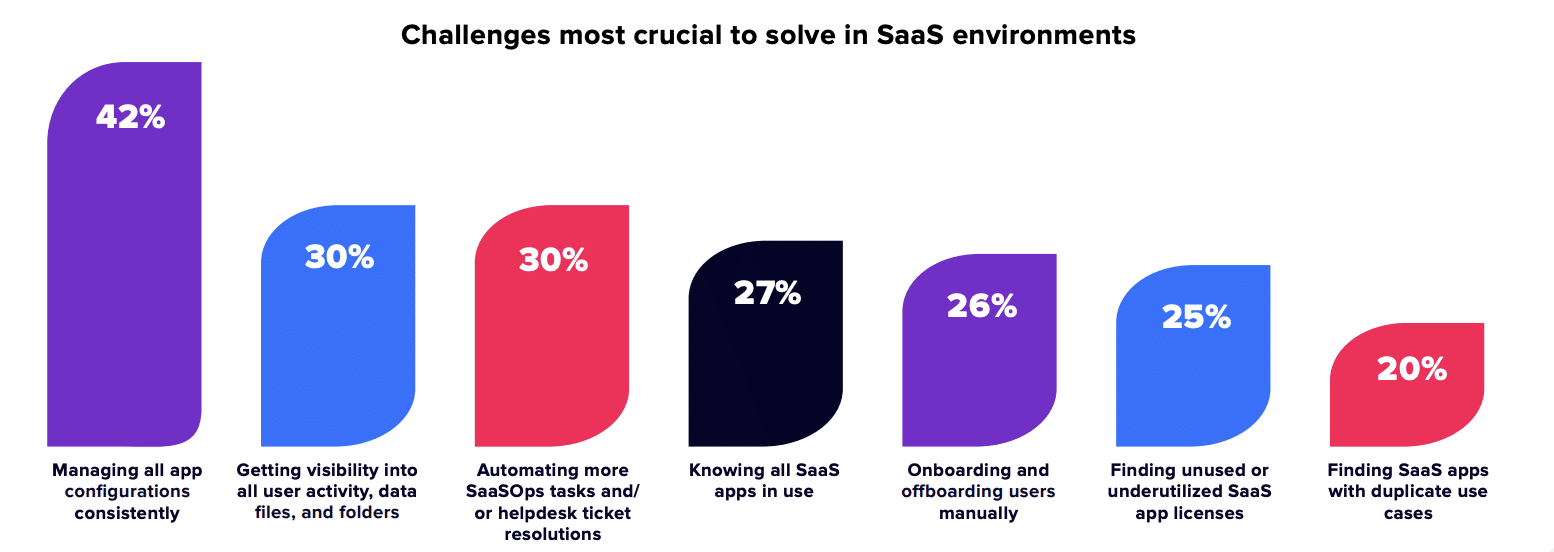
Meanwhile, nearly a third (30%) said that getting visibility into all user activity, data files, and folders and automating more SaaS tasks and/or helpdesk tickets were the largest challenges.
Furthermore, when organizations get bought or buy another company, it can be challenging to integrate multiple IT environments (Better Cloud, 2023).
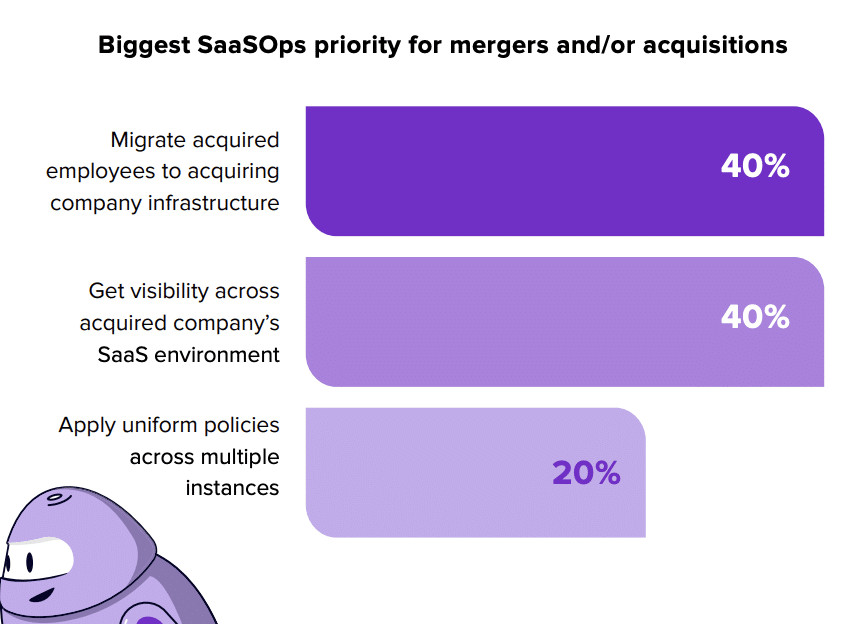
About 12% reported being bought by another company, and 13% reported buying or merging with another organization. This meant that SaaS priorities for mergers and/or acquisitions centered around migrating employees to their infrastructure or gaining visibility into the new acquisition’s SaaS environment.
When it comes to downtime, there was a total of 9,161 hours of cloud downtime in 2022 (Parametrix, 2023).
In total, there were 1,190 performance interruptions reported – four times the number reported by providers.
In fact, 10% of respondents reported third-party IT service-related issues (e.g., SaaS) as one of the most common causes of an IT outage that affected their organization between 2019 and 2022 (Uptime Institute, 2023).
SaaS in SMBs
Small to medium-sized businesses (SMBs) are increasingly turning to SaaS solutions. The main draw is their cost-effectiveness, letting businesses tap into cutting-edge technology without breaking the bank on upfront costs.
In 2023, small to medium-sized businesses (SMBs) saw a 5% increase in the average number of SaaS apps used compared to 2021 (Productiv, 2023).
The average number in 2023 was 253 SaaS apps. This growth indicates a broader acceptance and reliance on cloud-based solutions to meet diverse business needs.
Furthermore, in 2022, SMBs tended to sign two-year contracts with SaaS providers (Productiv, 2023).
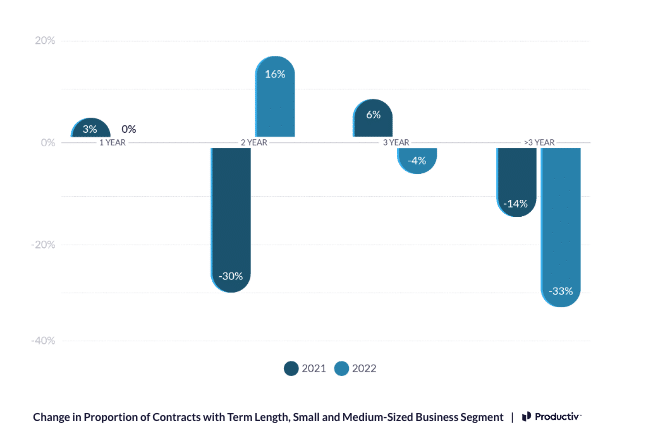
This marked a 16% increase in two-year contracts signed compared to 2021. Such longer-term contracts can often come with cost benefits, further emphasizing the cost-effectiveness of SaaS solutions for SMBs.
However, the SMB segment spent 11% more per employee on SaaS compared to the mid-market segment (Productiv, 2023).
These were the SaaS spends per employee according to business segments:
- Enterprises: $7,492
- Mid-market: $10,045
- SMBs: $11,196
This is likely driven by discounts being granted for large volume spending and enterprise-wide licensing agreements, as well as efficiency of scale with consumption-based SaaS apps.
At the same time, SMBs saw the highest levels of average licensing usage at 50% (Productiv, 2023).
This is keeping in mind that, on average, across all business segments, more than half of licenses continue to go unused over a 90-day period.
Security and Data Privacy
82% of security breaches involved data stored in the cloud in 2023 (IBM, 2023).
In fact, attackers often gained access to multiple environments, with 39% of breaches spanning multiple environments and incurring a cost of $4.75 million.
The leading concern for most organizations in 2022 was securing SaaS apps (Better Cloud, 2023).
This goes beyond security reviews for new software; it also includes securing user activity and their data, receiving alerts when inappropriate file sharing occurs, and remediating it properly.
This was a concern for 37% of organizations.
The most prevalent SaaS-related security issue in 2022 was that nearly half (43%) of organizations added a new SaaS app that stored sensitive data (Better Cloud, 2023).
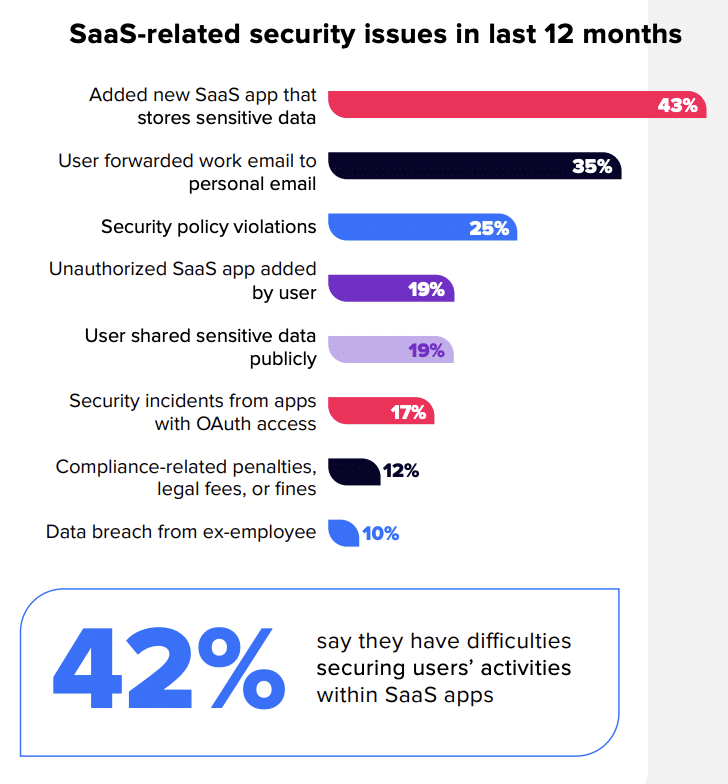
Other related issues were users forwarding work emails to personal emails (35% of organizations) and security policy violations (25%).
In fact, nearly a fifth of respondents (17%) stated that improving SaaS data protection to reduce risk is a big priority for 2023 (Better Cloud, 2023).
Larger priorities included strengthening IT and business collaboration (24%) and automating more SaaS-related processes (20%).
There’s also a growing commitment to providing resources to manage SaaS environments within organizations (Better Cloud, 2023).
58% of respondents said that their organization invested enough to protect data within SaaS apps in 2022, up from 48% in 2021.
Meanwhile, more than a third (38%) of respondents identified SaaS apps as a top target for cyberattacks (Thales Group, 2023).
In fact, 46% said they experienced a data breach in their cloud environment in 2022.
Furthermore, more than a third (37%) of global respondents reported having 40% or more of their employees using multi-factor authentication for cloud and SaaS apps in 2022 (Thales Group, 2022).
This is a sharp increase from only 12% in 2021.
SaaS and AI
The landscape of SaaS is undergoing a transformative shift, particularly with the infusion of artificial intelligence (AI) capabilities. As the latest SaaS statistics show, AI is not just a buzzword but a critical component shaping the future of cloud-based services.
82% of cloud companies already have AI-driven features in their SaaS products (BVP, 2023).
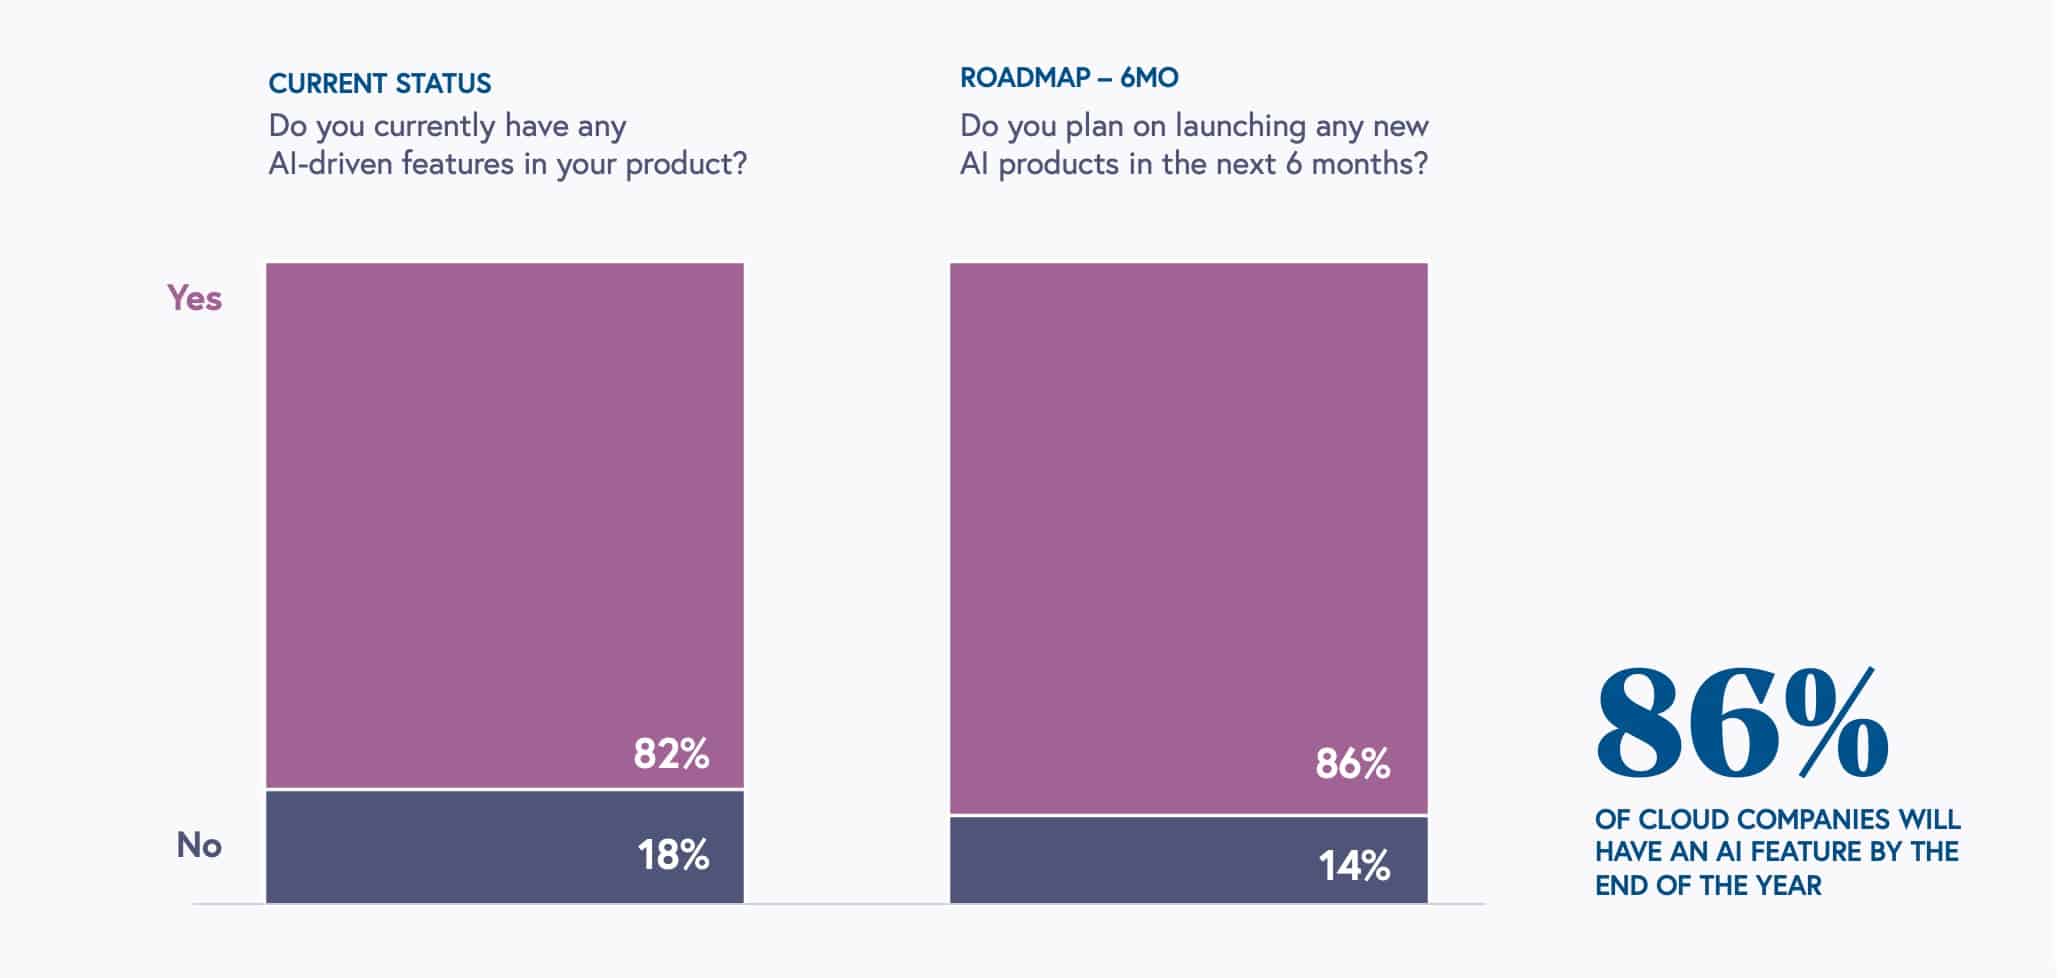
Of the 18% that said they don’t, 86% plan to have AI features by the end of 2023.
In fact, the integration of generative AI into SaaS and web applications is increasingly becoming the norm (Kristi Hines, 2023).
As of August 2023, the market offers over 800 plugins specifically designed for ChatGPT.
However, it appears that AI integration doesn’t strongly influence SaaS purchasing as of Q2 2023 (Vendr, 2023).
Despite this, both buyers and sellers should evaluate SaaS AI capabilities to decide if they are useful additions.
It’s relevant to note that investment in AI SaaS startups reached $43.0 billion in 2022 (Dealroom, 2023).
Although this is down 38% compared to 2021, it is up 4% compared to 2020.
The Bottom Line
In conclusion, the SaaS landscape in 2023 shows promise and growth. It’s marked by rising revenues and new pricing models. A shift towards AI is also evident.
However, challenges exist, with security being a big concern given the rise in cloud data breaches. SMBs are also adopting SaaS at a fast pace yet face issues like high costs and unused licenses. Furthermore, AI’s role in SaaS is growing, but its impact on buying choices is still limited.
These SaaS statistics serve as a guide for organizations. They help in making smart choices in a complex market, making them key for anyone looking to make the most of SaaS in today’s digital world.